2020 Reader Survey Results
Thanks so much to everyone who took the time to fill out my second reader survey. I was hoping to get 500 responses and you far exceeded that—I ended up with 675. You’re wonderful. Below are the results, along with some findings from other sources for an even fuller picture.
Demographics
Let’s start by describing you by interest rather than identity. No surprise that most of you consider yourselves avid beer fans. Almost a third of you work in the industry, either as brewers (10%) or otherwise. A quarter of you are homebrewers—which is surprisingly way down from 2018 when nearly 40% of you were. Only a fraction of you work in media, which surprised me.
Most of the people who read this blog are interested in good or “craft” beer (very broadly defined), and they reflect some of the demographics of the larger drinking population. Most depressingly, avid beer fans are overwhelmingly white. We’ve known about this a long time (my earliest post discussing the problem is from a decade ago), and no one seems to be doing a great job with it—including me. Ninety-percent of respondents were white. (Of those who were not, 1% were Black, 2% were Asian, 2% were Latino, 1% were Native American or Pacific Islanders, and the remainder identified multiple races; 3% of you identified your ethnicity as Hispanic.)


I was saddened to see that few of you were women, either. More and more women have come to beer, and in Portland fandom is evenly divided. Still, 90% of you were men. Clearly, I have some work to do to appeal to those of you who aren’t white and male. On the age and location front, you are more diverse. About half of you are millennials or Gen Z. Nearly two-thirds are younger than 45. In 2018, over half of the readers were from the Pacific Northwest; the figure is dropping (though half of you are West Coasters). More of you read from outside the US, which may have to do with my recent travels to Europe.
Content Preferences
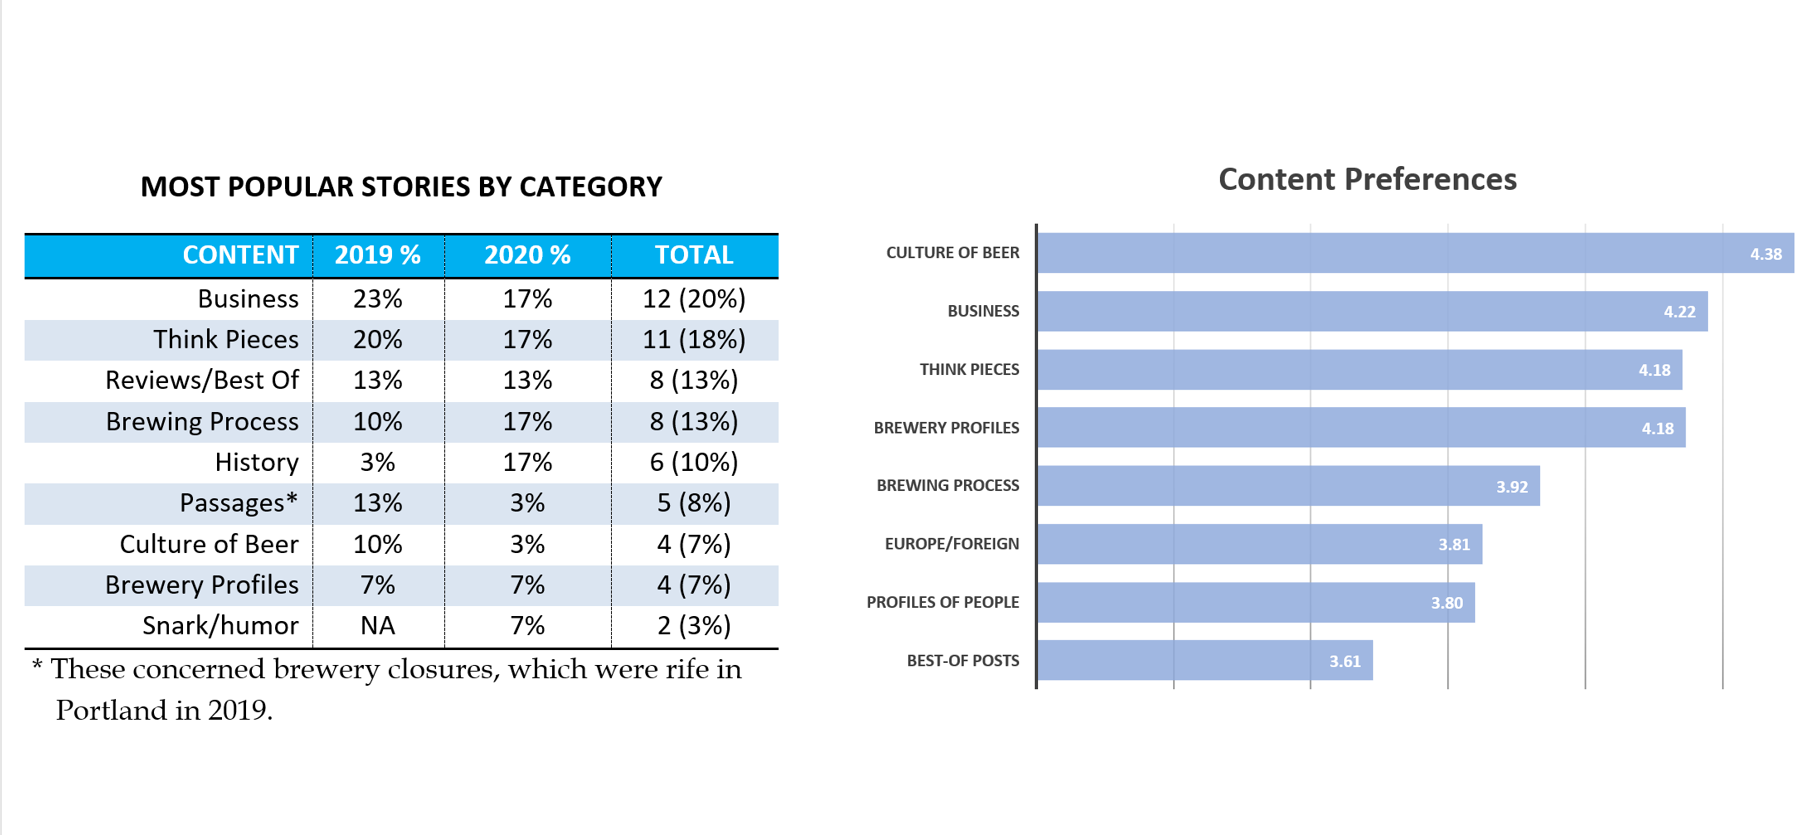
I was curious to see how you’d rate the different types of content that typically appear here. I recently did an analysis of the thirty posts with the most traffic in 2019 and through this point in 2020 to compare. These don’t measure quite the same thing. The 675 of you who filled out the survey are more active readers; the core audience. Traffic is capricious. By far the most popular post this year is a snarky jab at Bud Light Seltzer. Google loves it, and it still returns the second result when you Google the name. Nevertheless, the two line up reasonably well. In the second chart, I converted the ratings to a five-point scale where 1 and 2 are negative impressions of that type of content, 3 is neutral, and 4 and 5 are positive.
Consumption Habits
Finally, a few words about how you consume content these days, with data from Squarespace and Google Analytics. More and more, people read on their phones or tablets. This trend has hastened in 2020, as the Coronavirus has kept many people home. Currently two-thirds of you read Beervana on your phone (63%) or a tablet (4%). Only a third read on a computer. Half my referrals now comes via web search, and my archives feed a lot of my traffic. Just 25% of people visit the site directly, but that actually exceeds the number who come from social media. Of those who do, 56% are referred by Facebook, 42% by Twitter and a bit from Instagram and Reddit). Those trends are a bit surprising. I suspeced that a lot of you find me here via social media, but apparently it’s not true.
Again, I really want to thank everyone who participated in the survey.